Merit Order
GitHub

Demo

See the console without installing anything.

The demo at dev.meritorder.dev is the Merit Order console running in your browser on sample data. Nothing is sent anywhere and there's nothing to sign in to.

What to look at

Five pages worth a minute each.

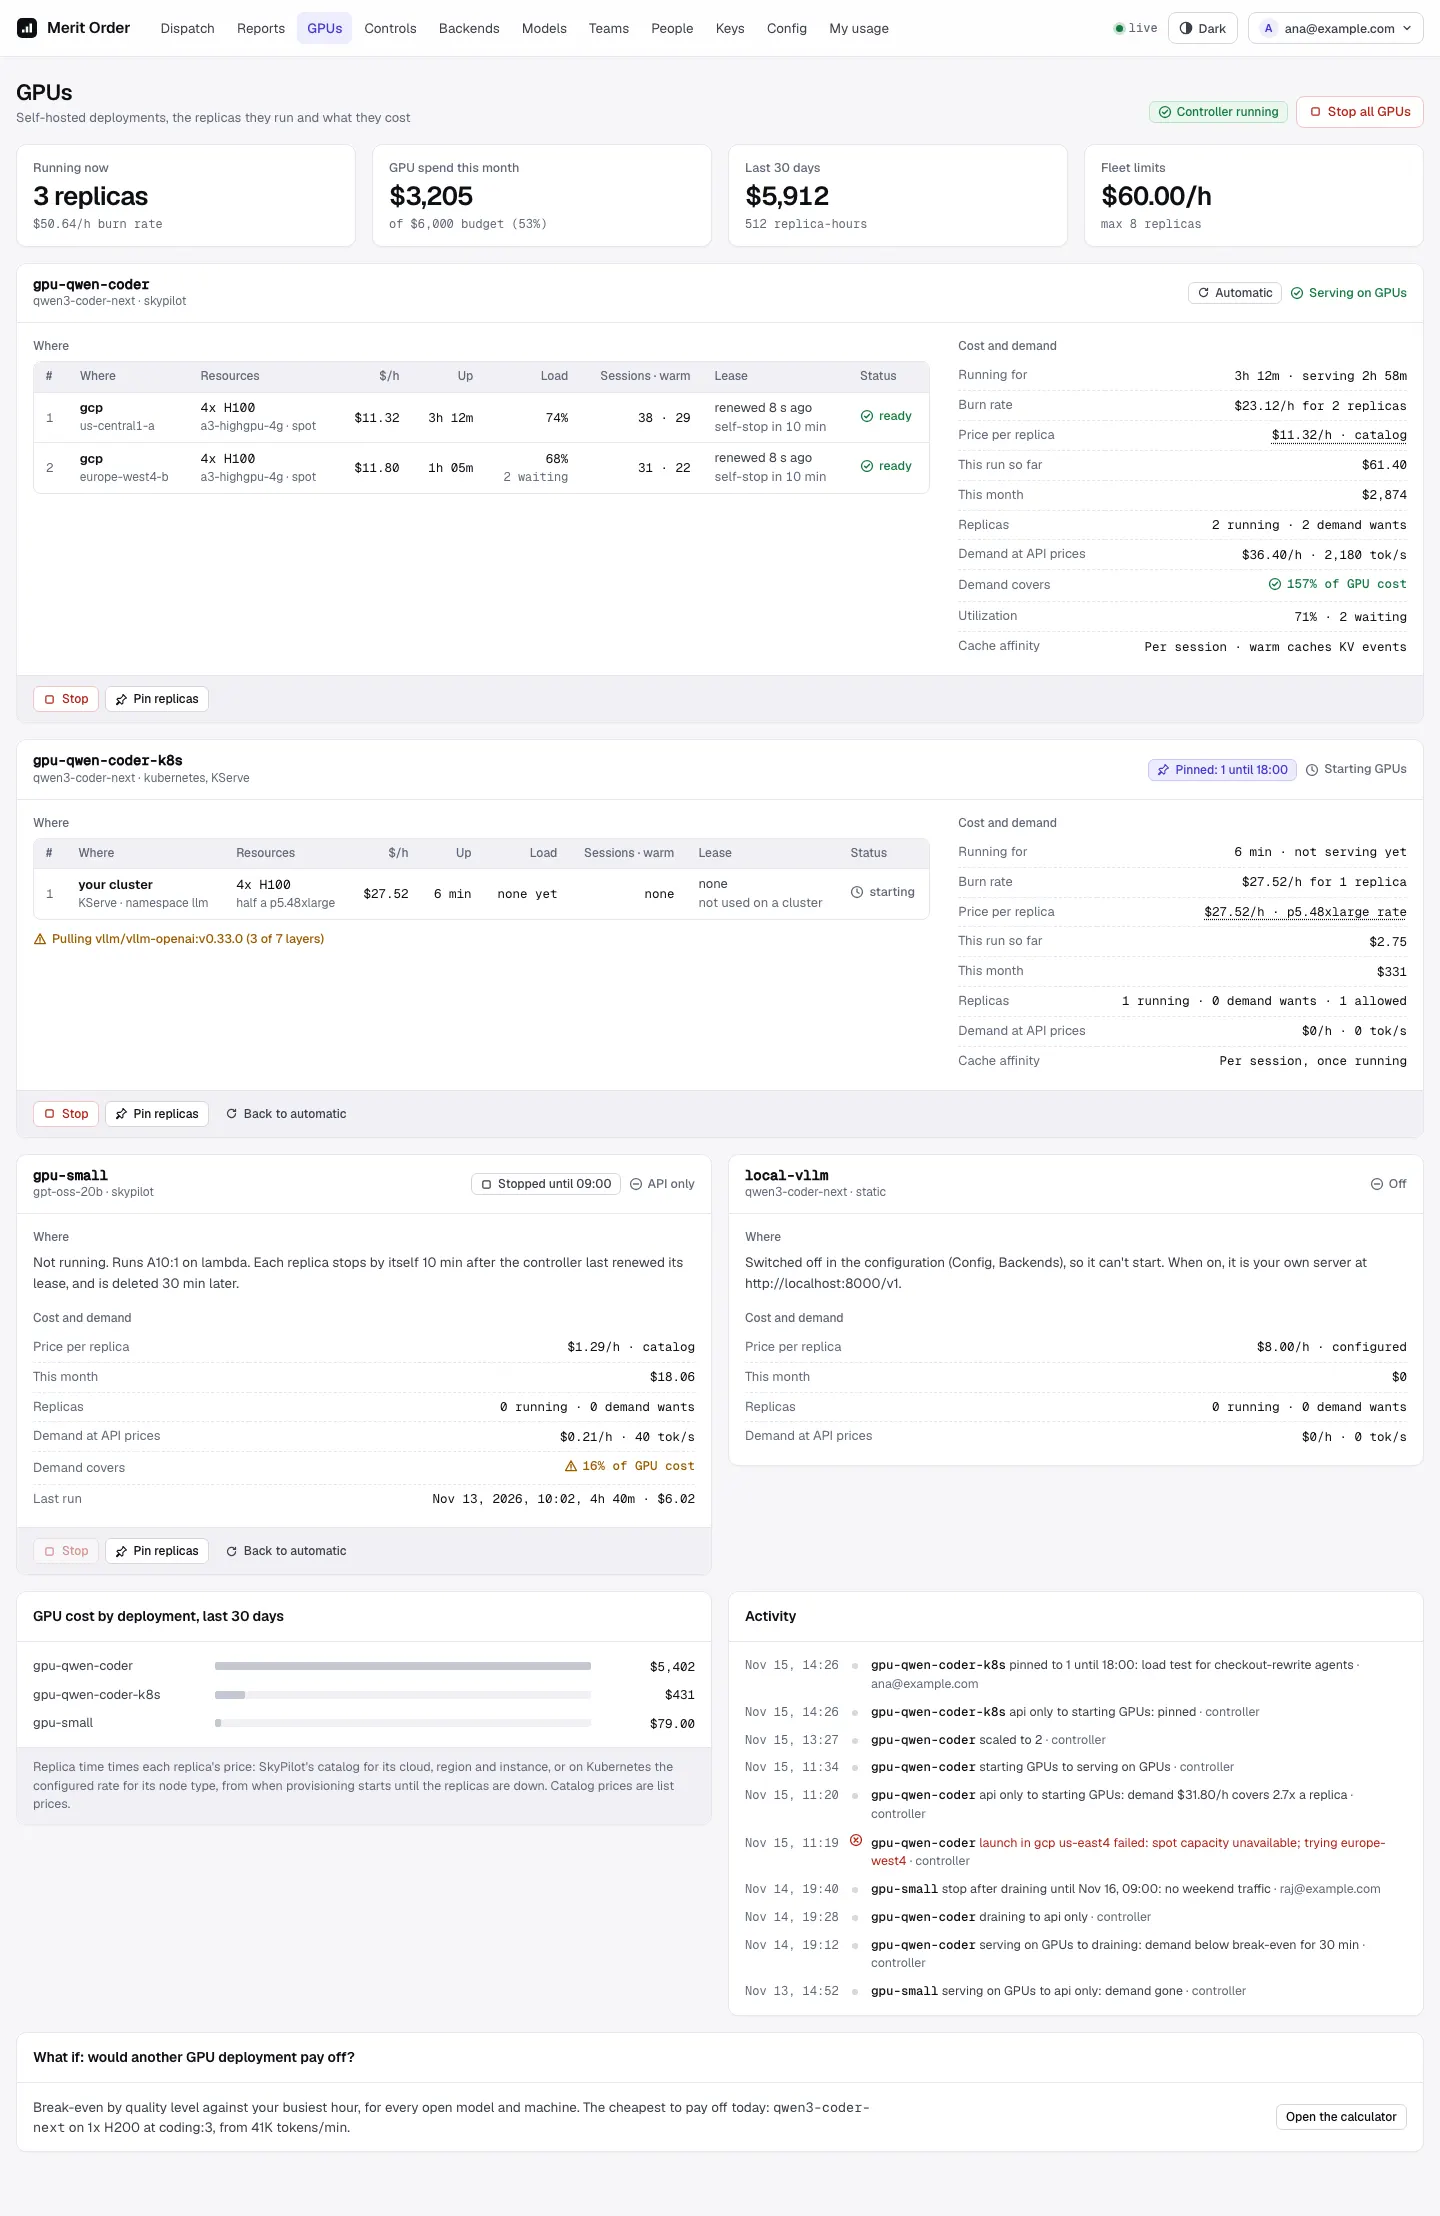
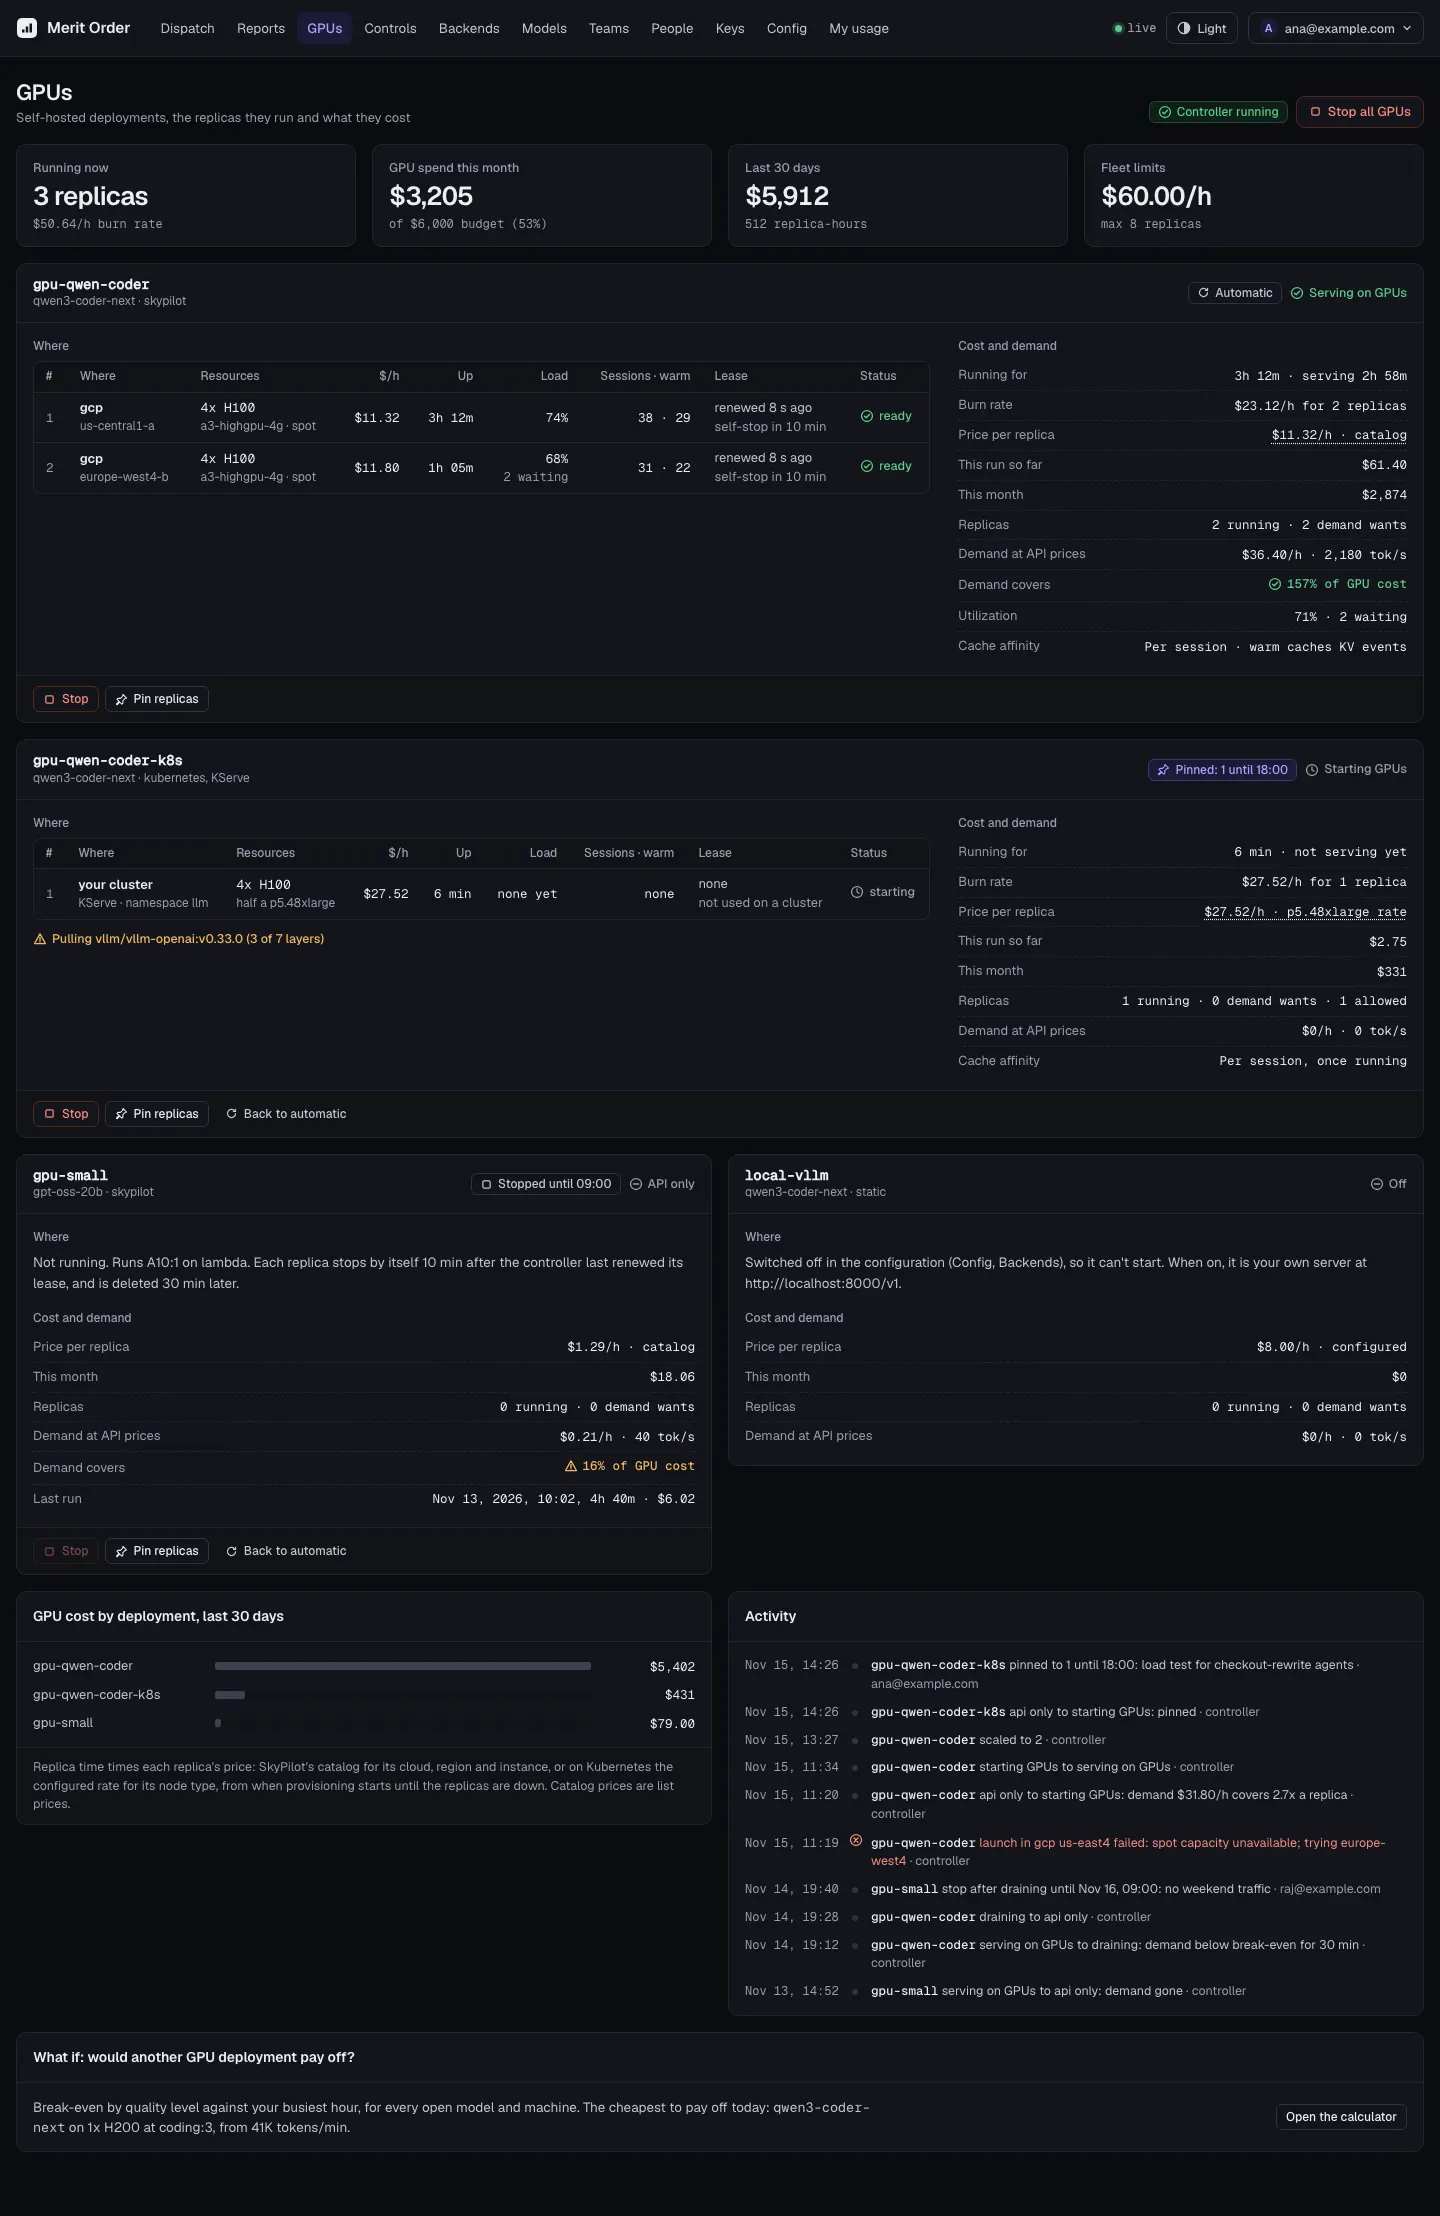
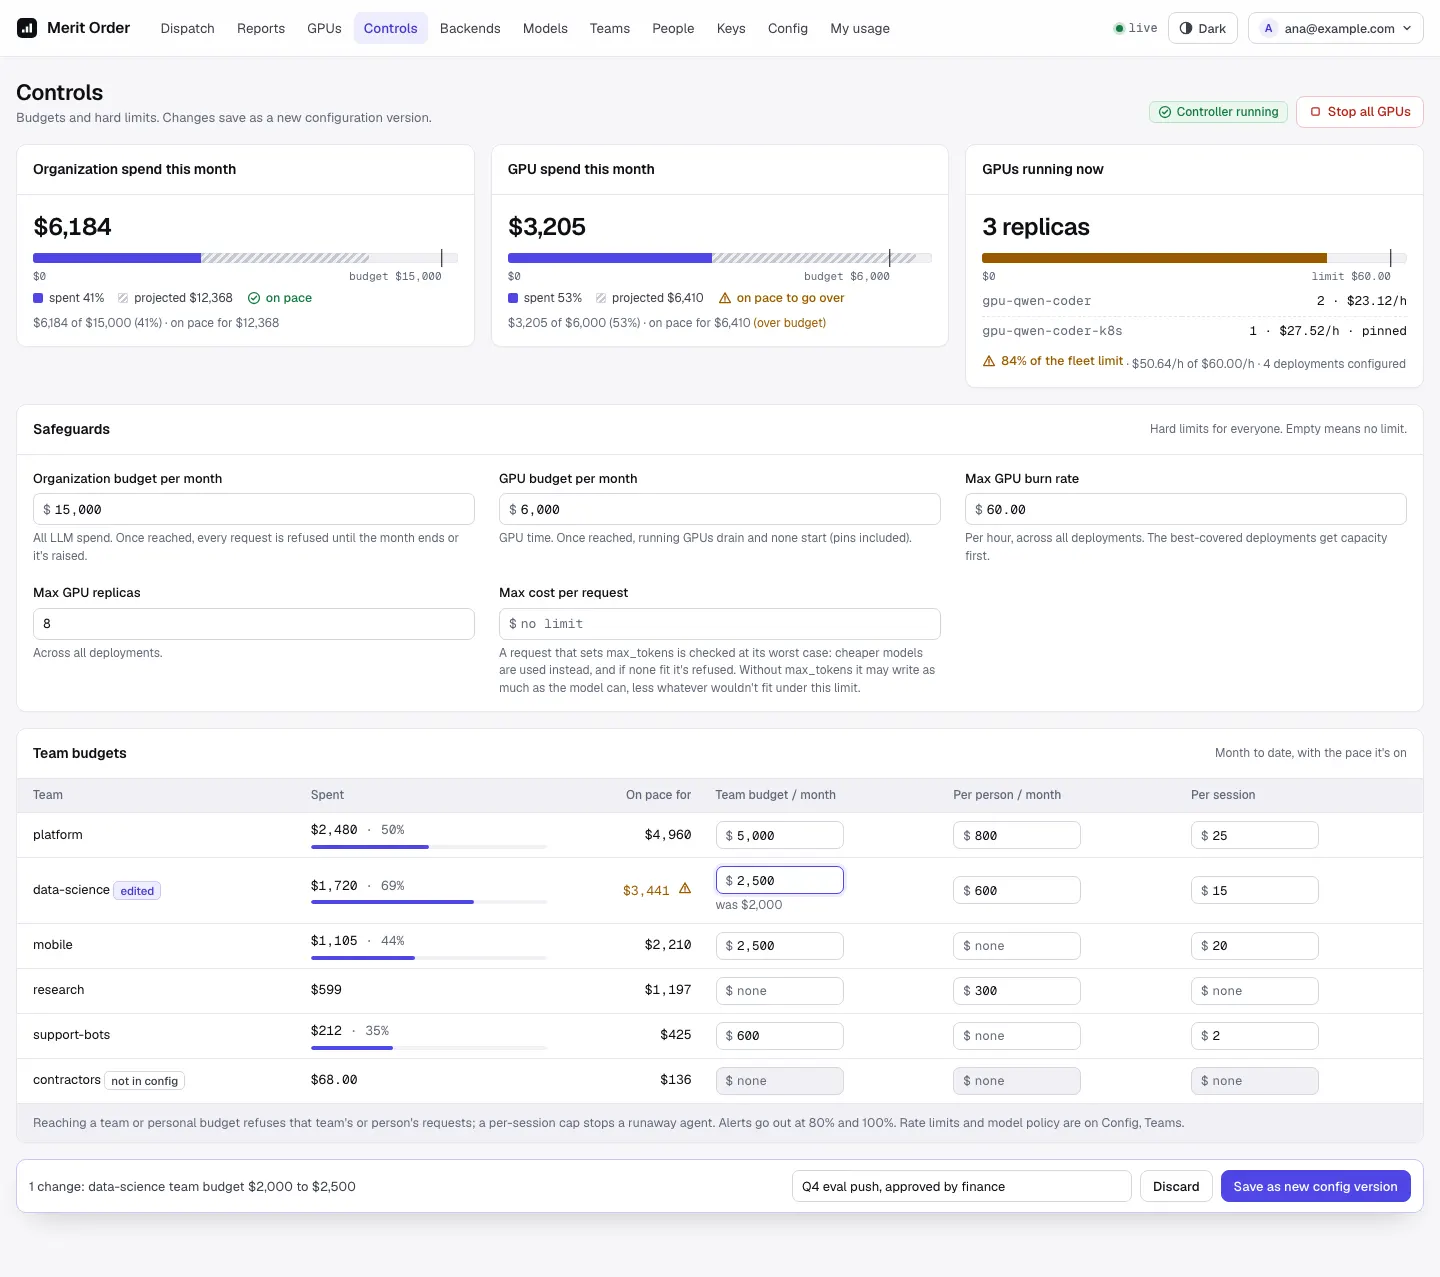
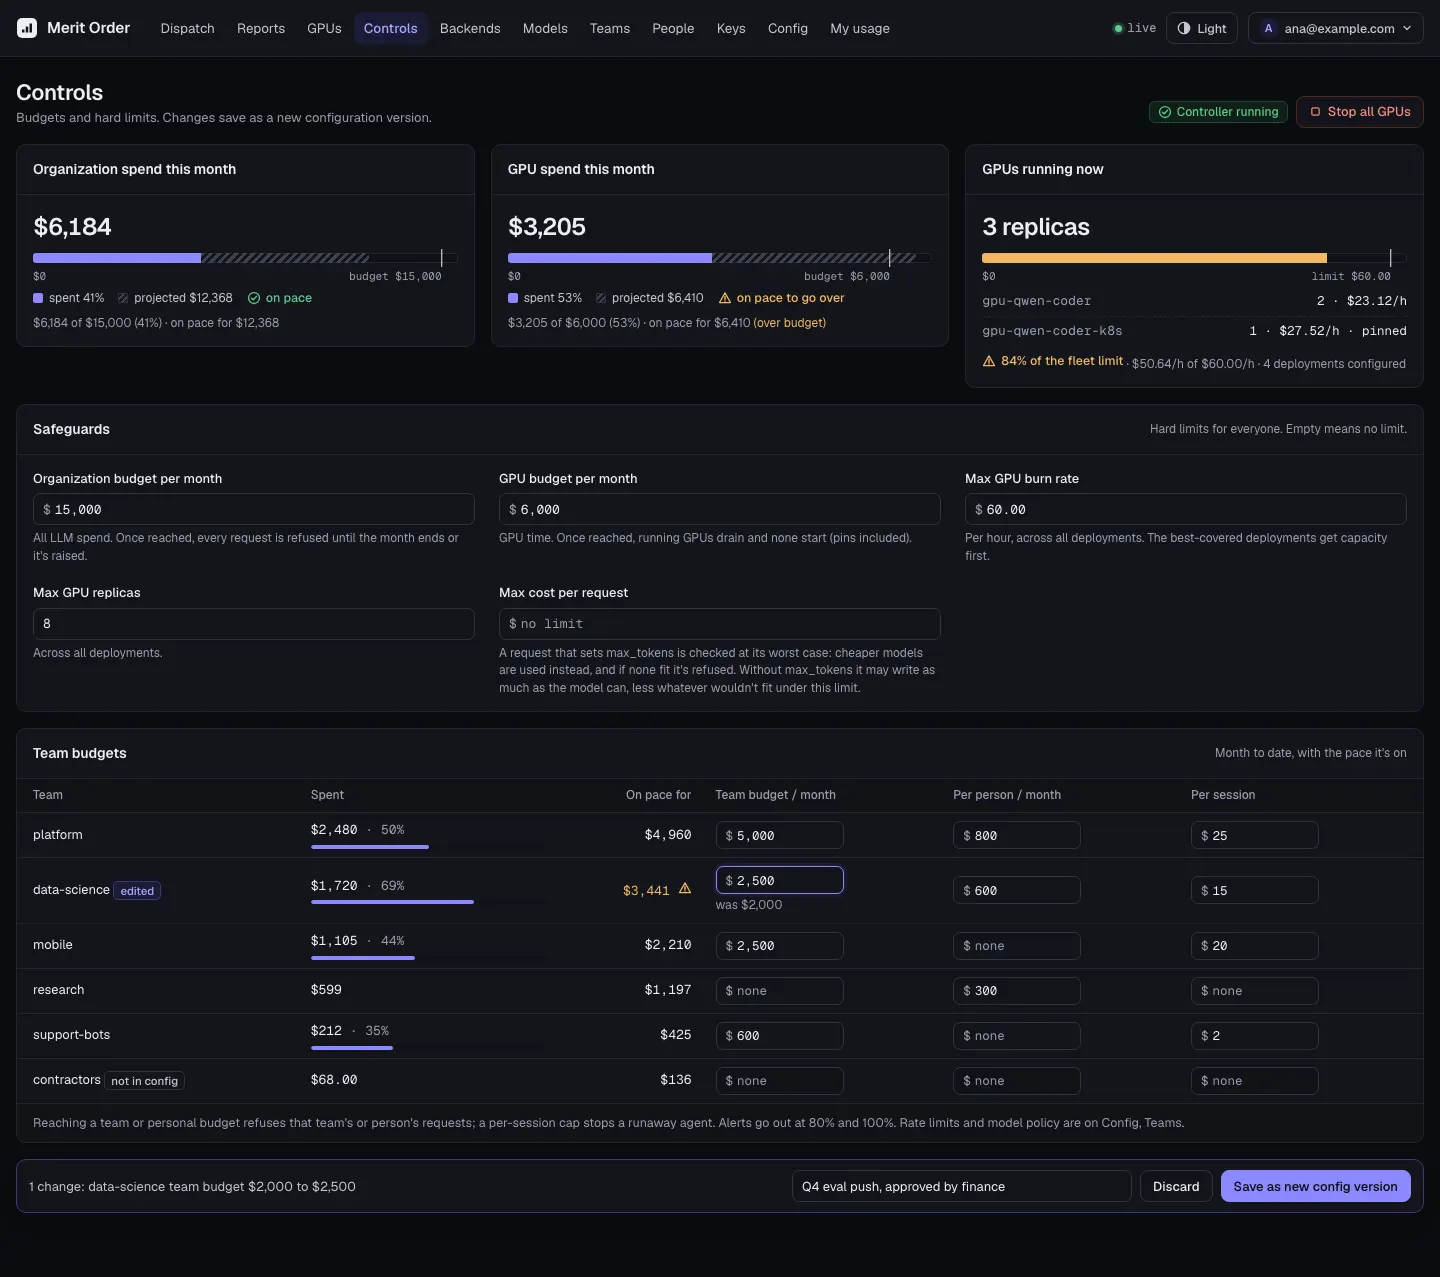
These pictures are design mockups of the console with made-up sample data (an example organization in mid-November 2026). They show what the pages look like, not measured results. The figures in them, such as the share saved, are illustrations.
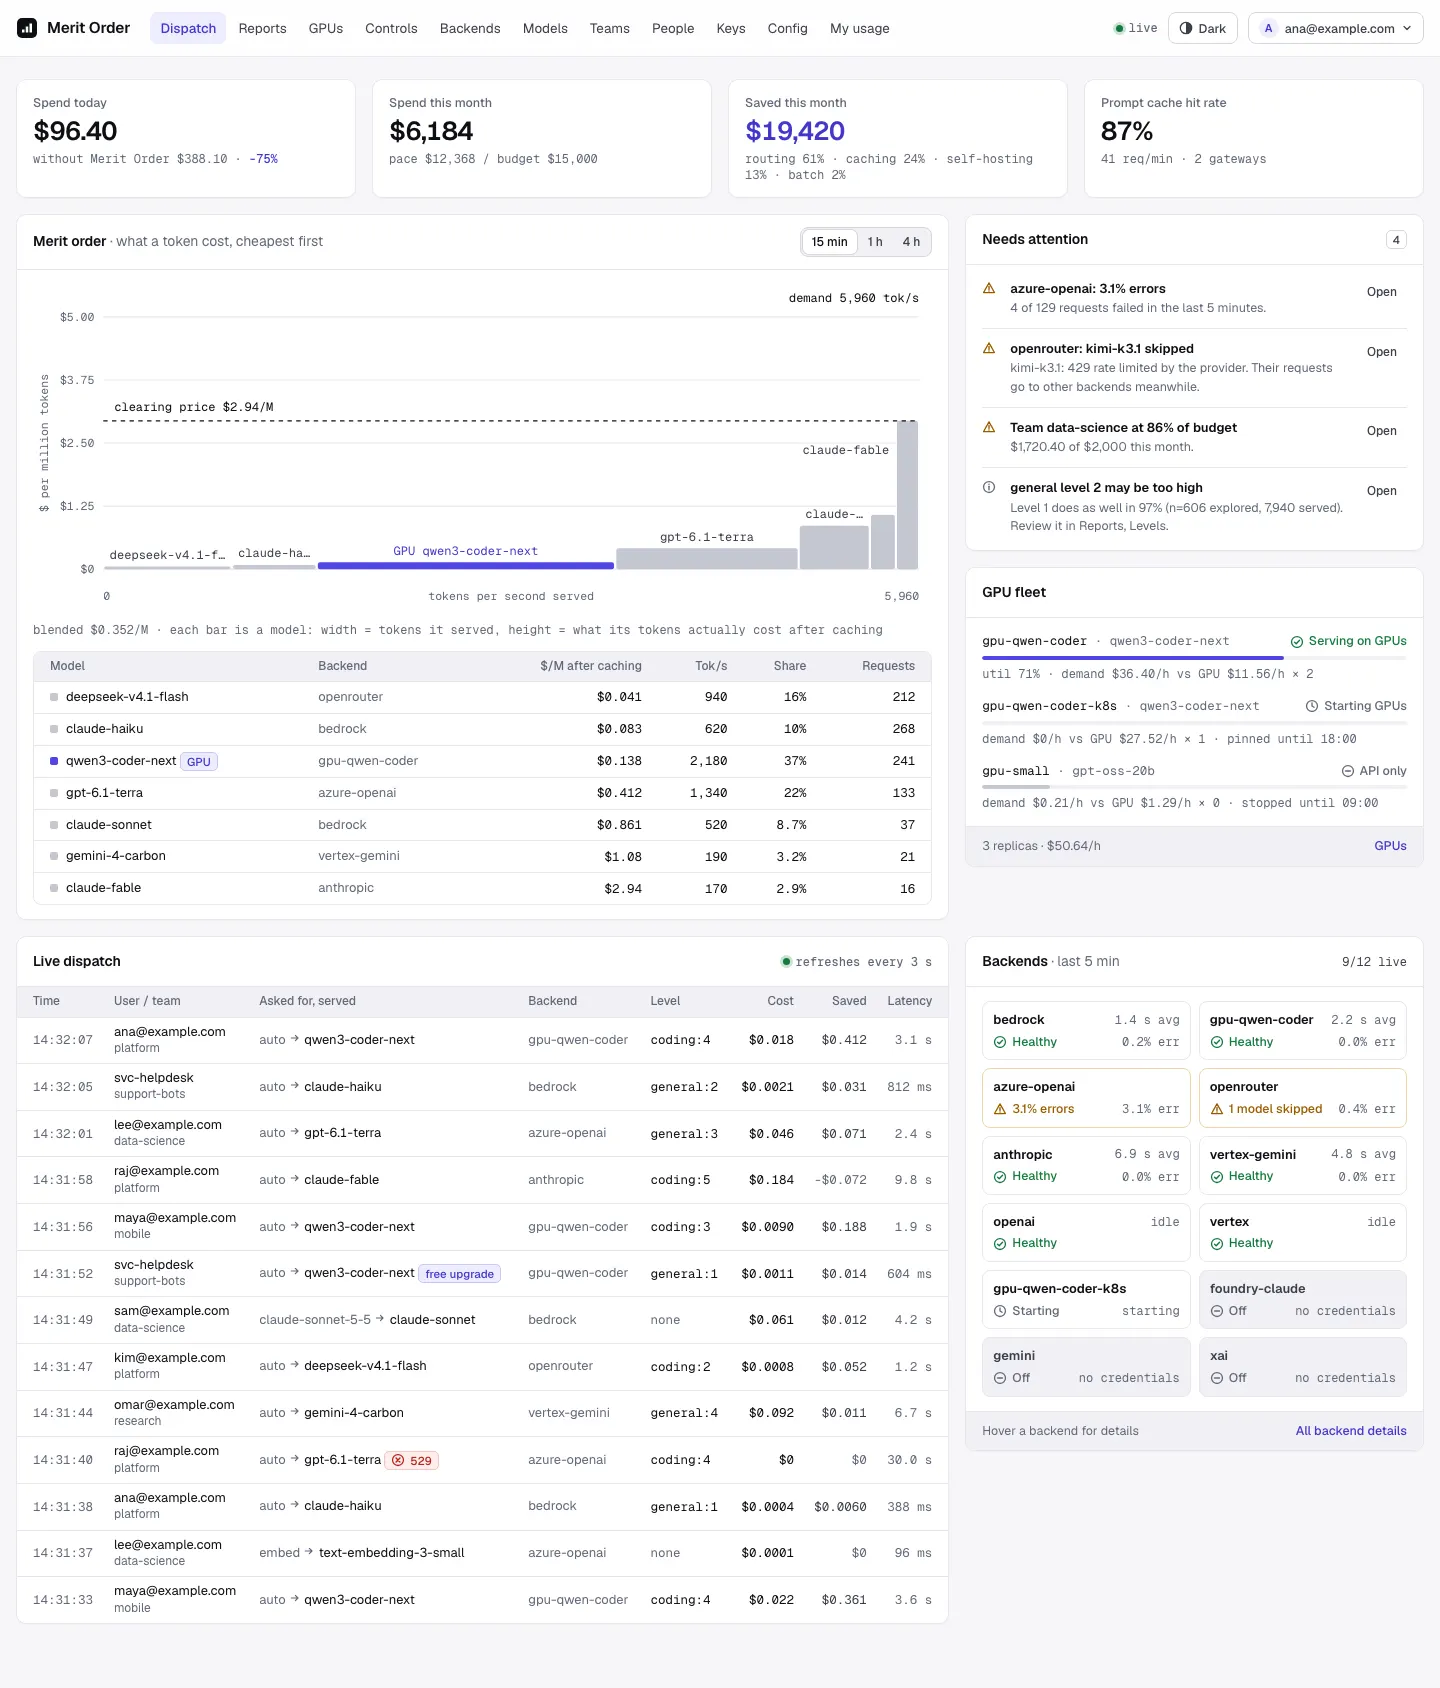
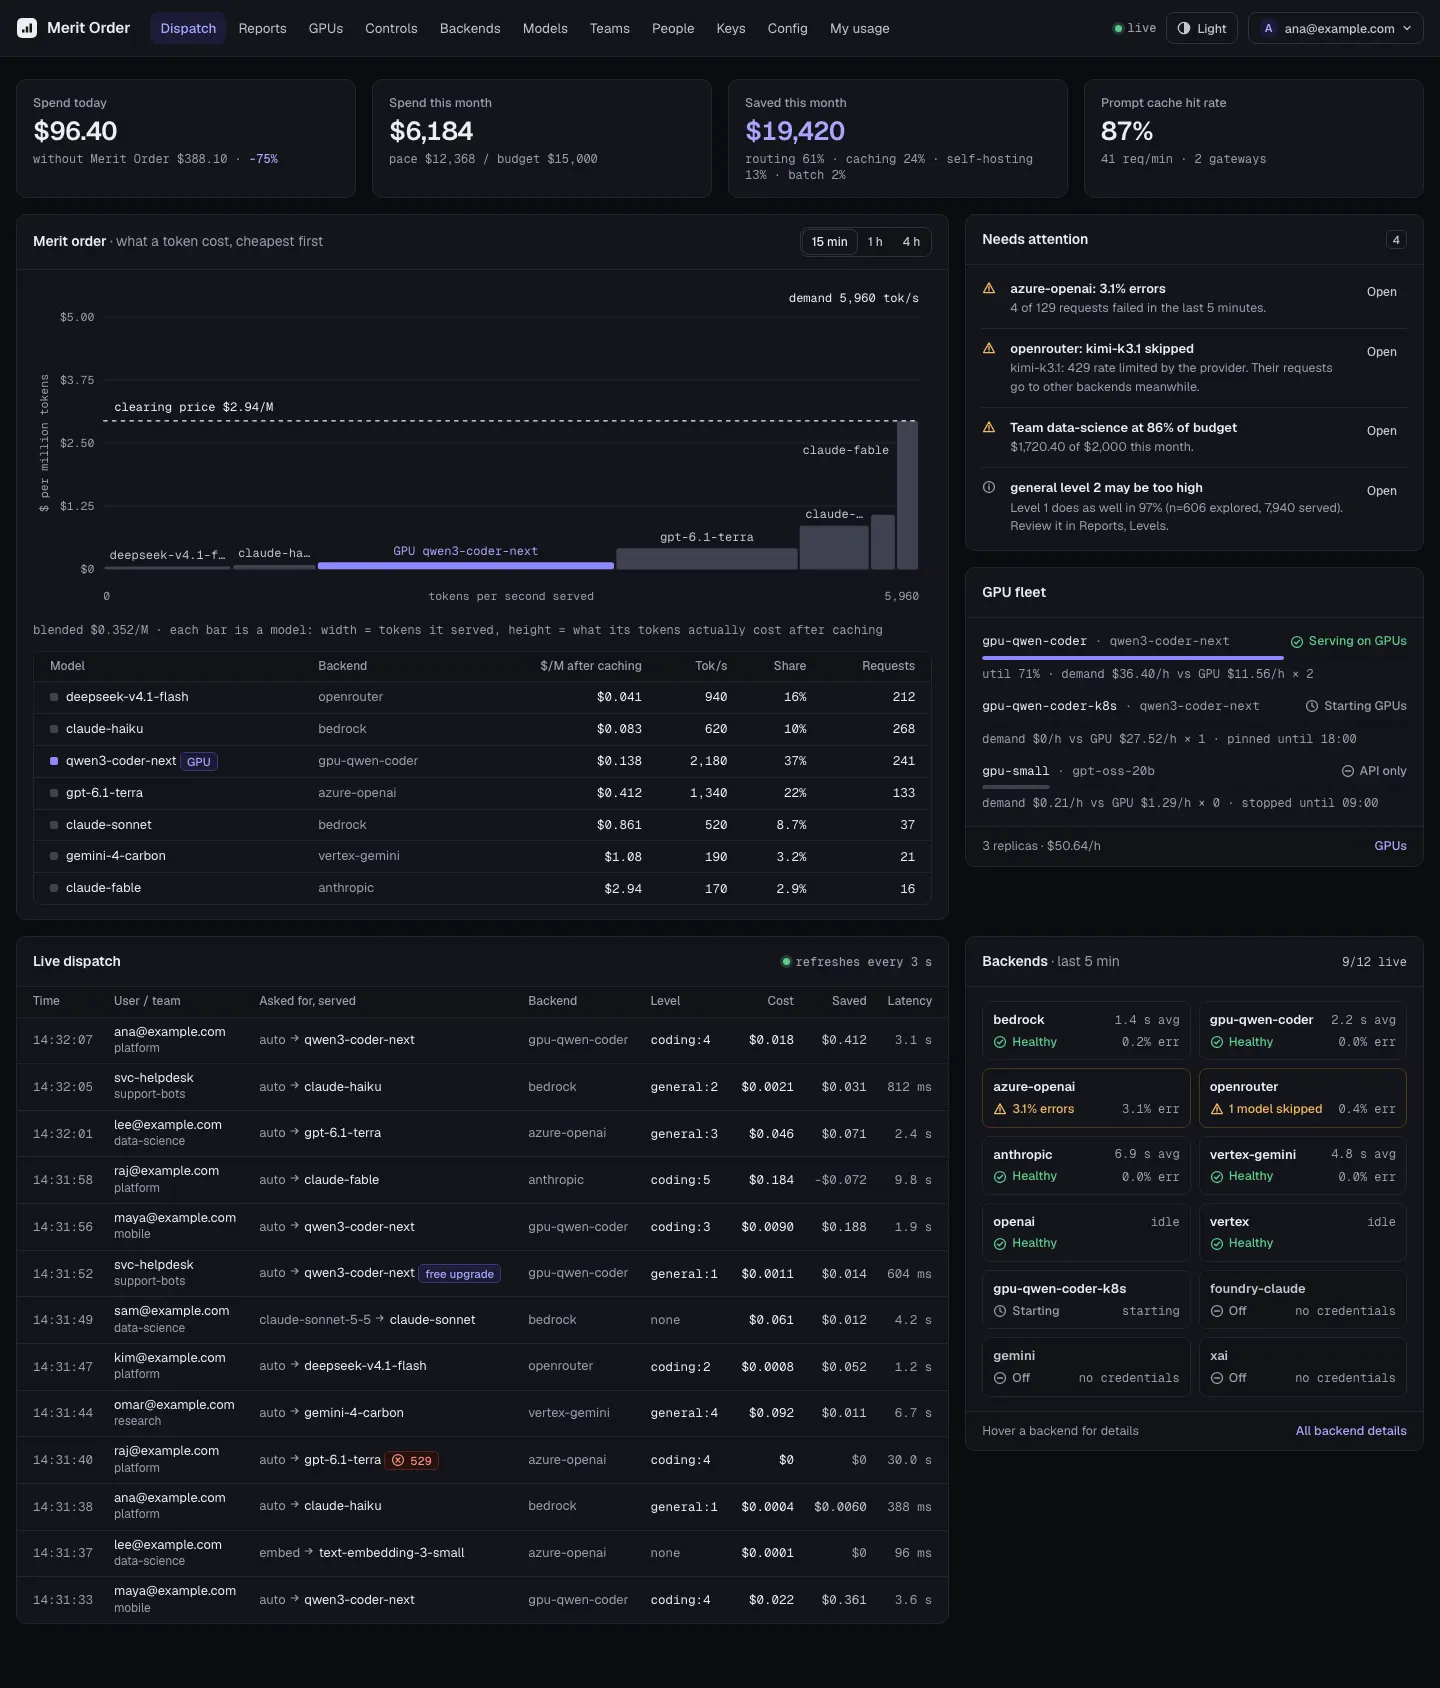
The Dispatch page: spend today and this month, the merit-order stack of models by price per million tokens, a live feed of requests with the model asked for and served, and backend health.The Dispatch page: spend today and this month, the merit-order stack of models by price per million tokens, a live feed of requests with the model asked for and served, and backend health.
Dispatch. The merit-order chart: each bar is a model, as wide as the tokens it served and as tall as what they cost after caching. In the live feed, "auto → claude-haiku" shows what each request asked for and got, at which level, and what it saved.
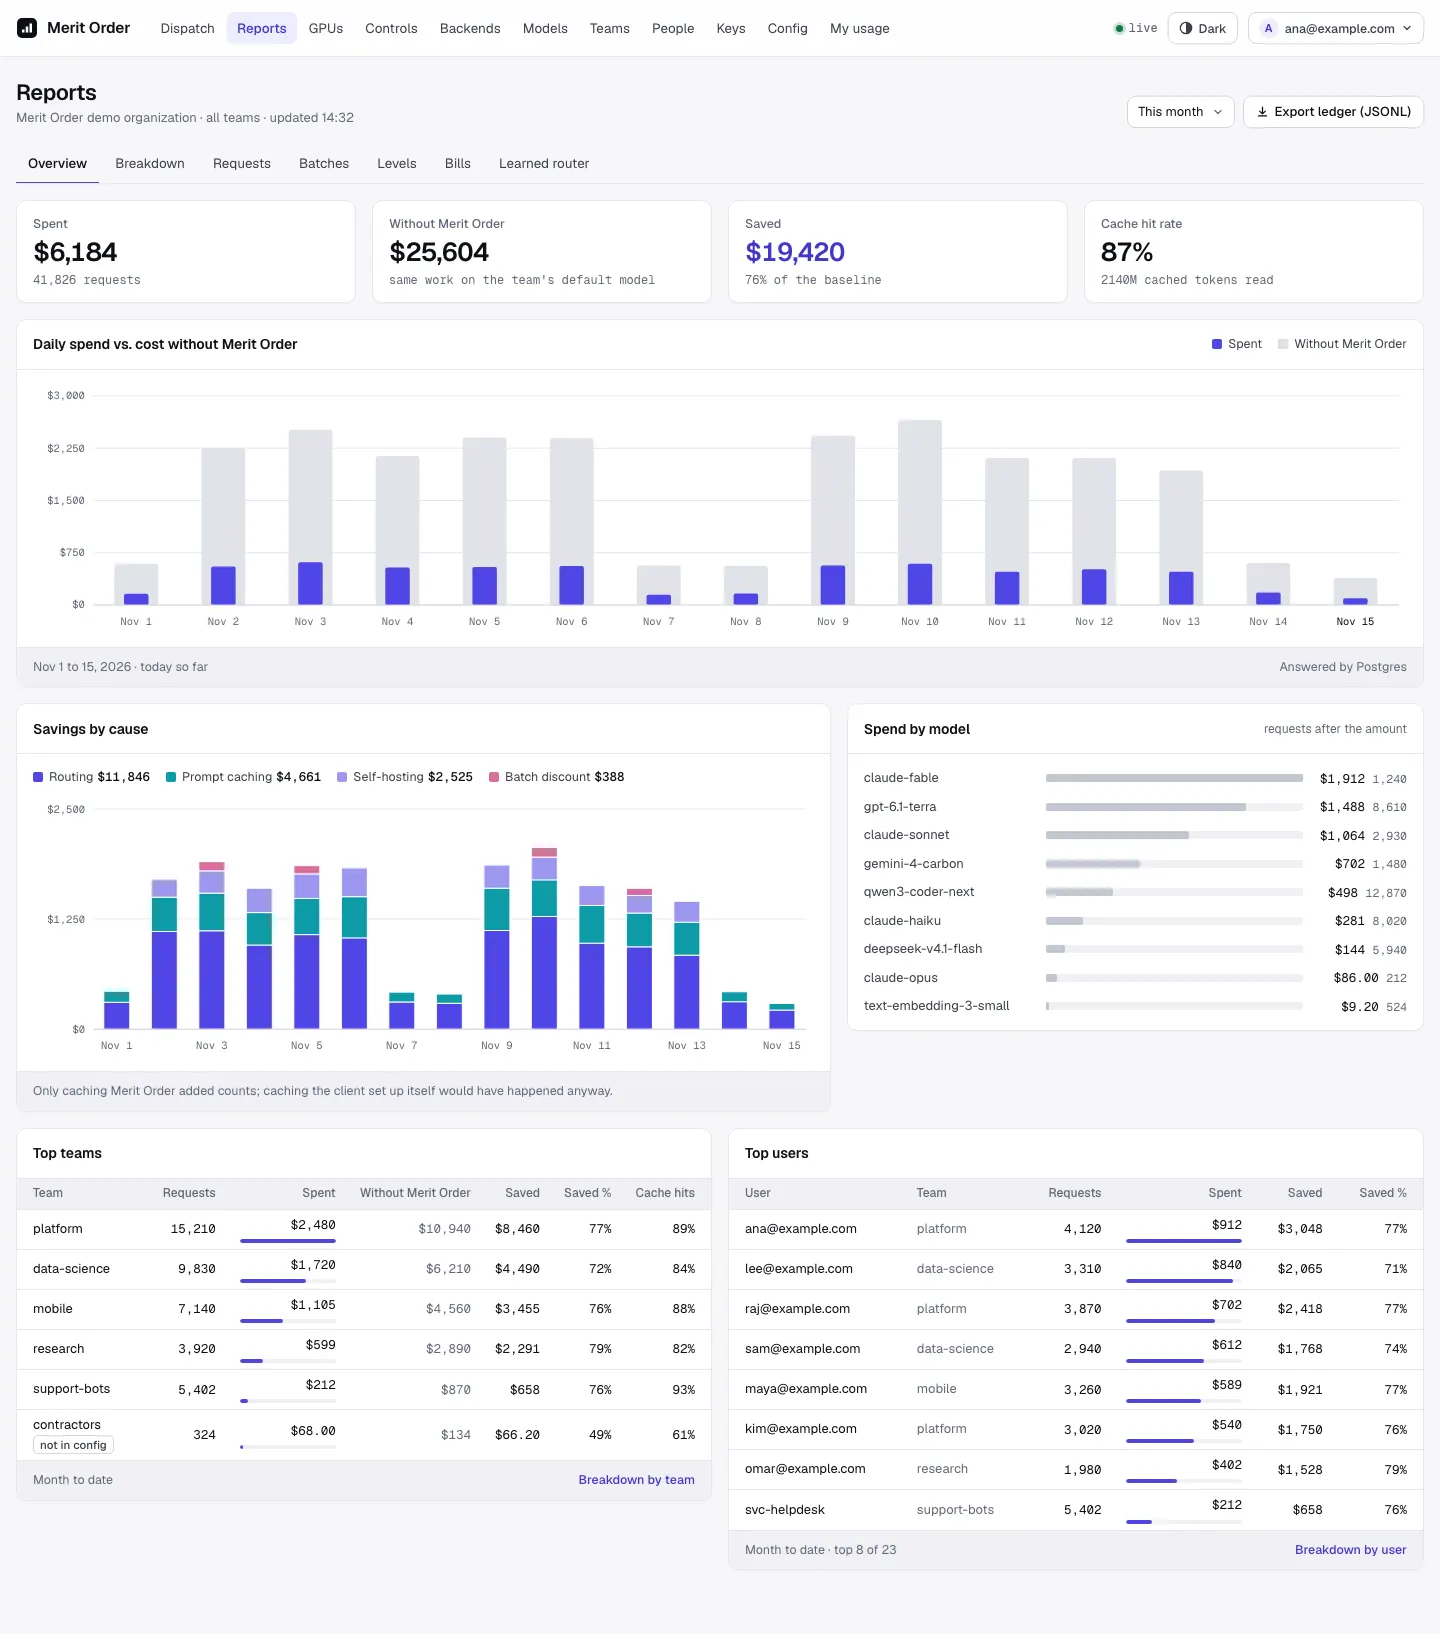
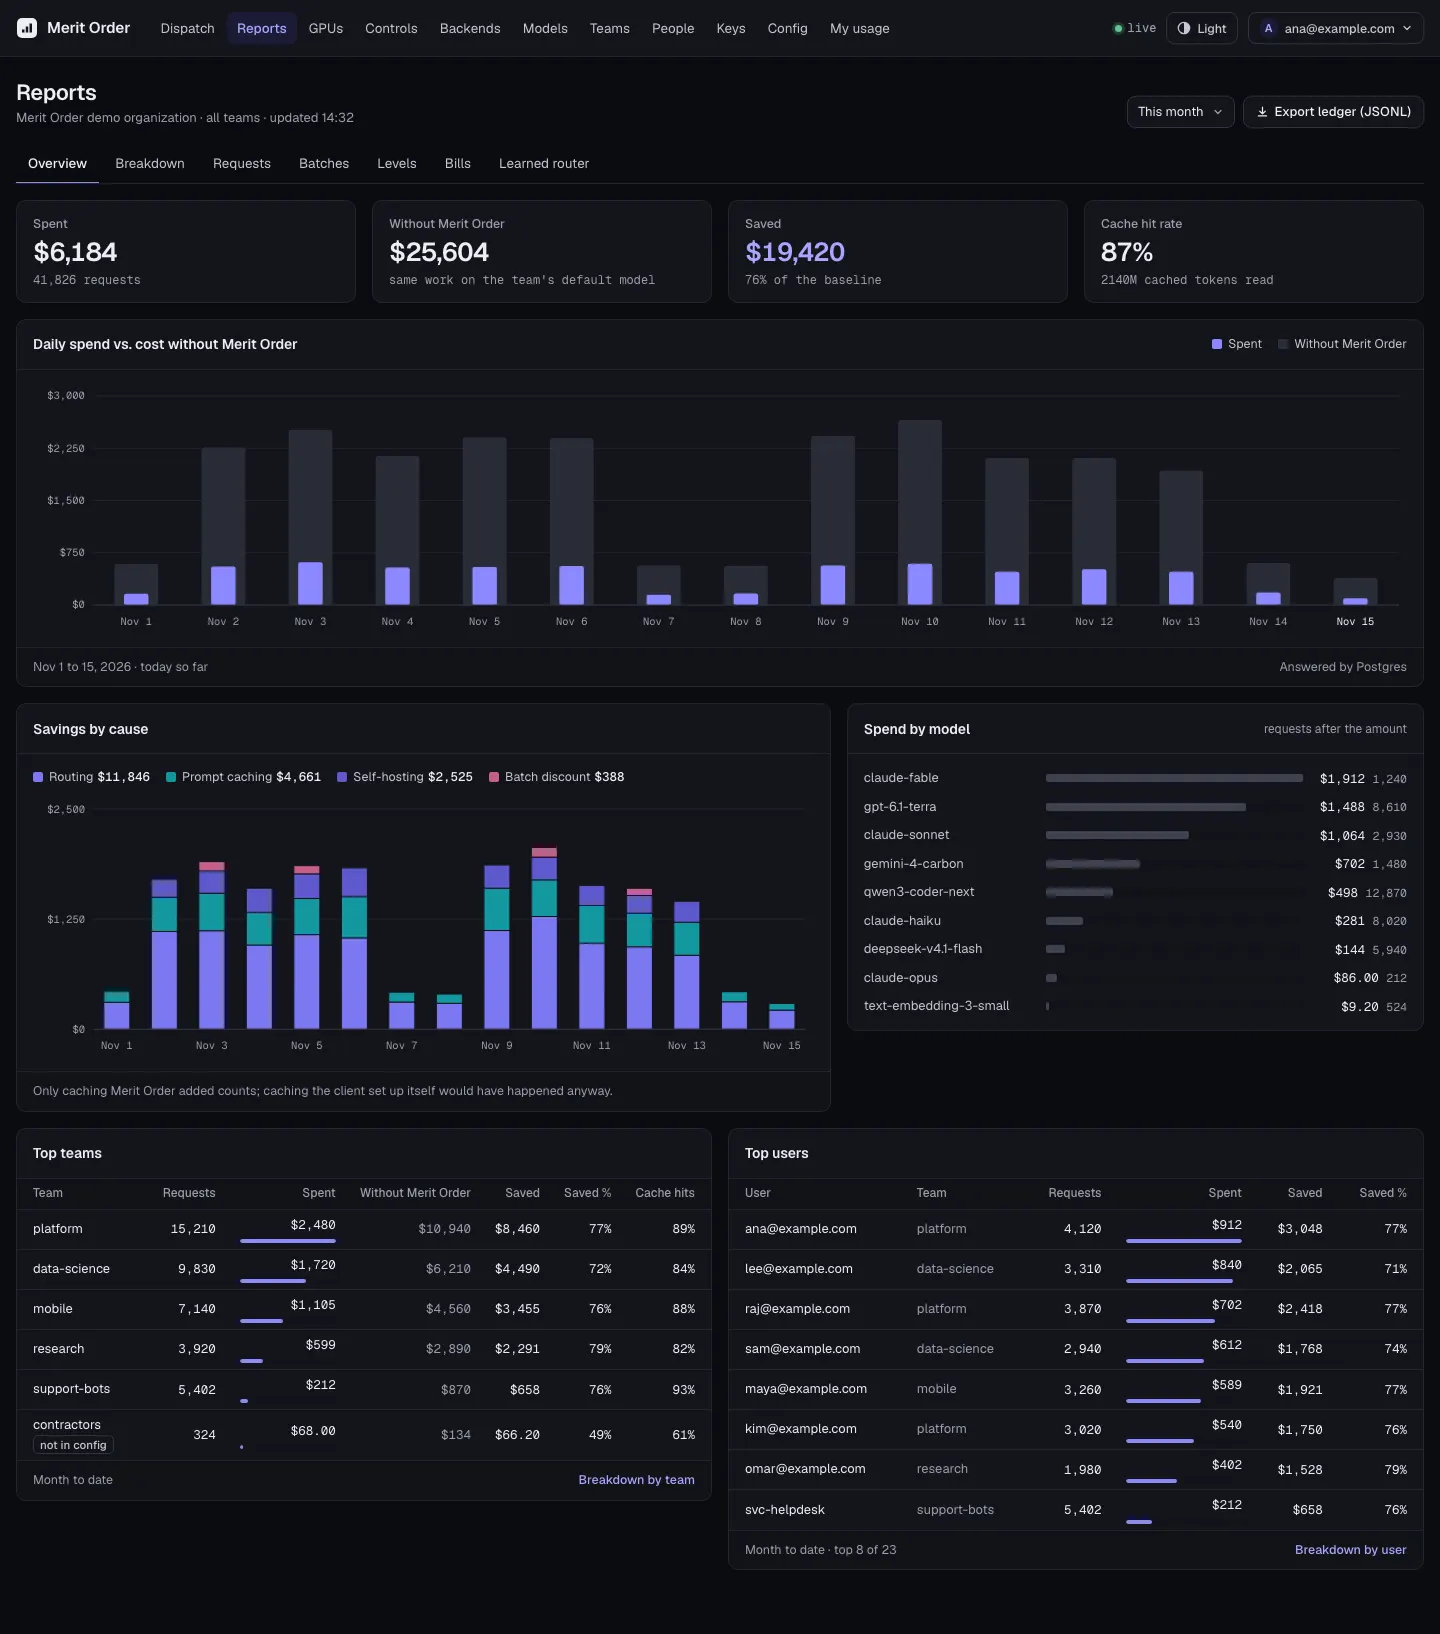
The Reports overview: spent, cost without Merit Order, saved and cache hit rate; daily spend against the baseline; savings by cause; spend by model; top teams and users.The Reports overview: spent, cost without Merit Order, saved and cache hit rate; daily spend against the baseline; savings by cause; spend by model; top teams and users.
Reports, Overview. Savings by cause: routing, prompt caching, self-hosting and batch, stacked per day. They add up to the total because each is computed against the one before.
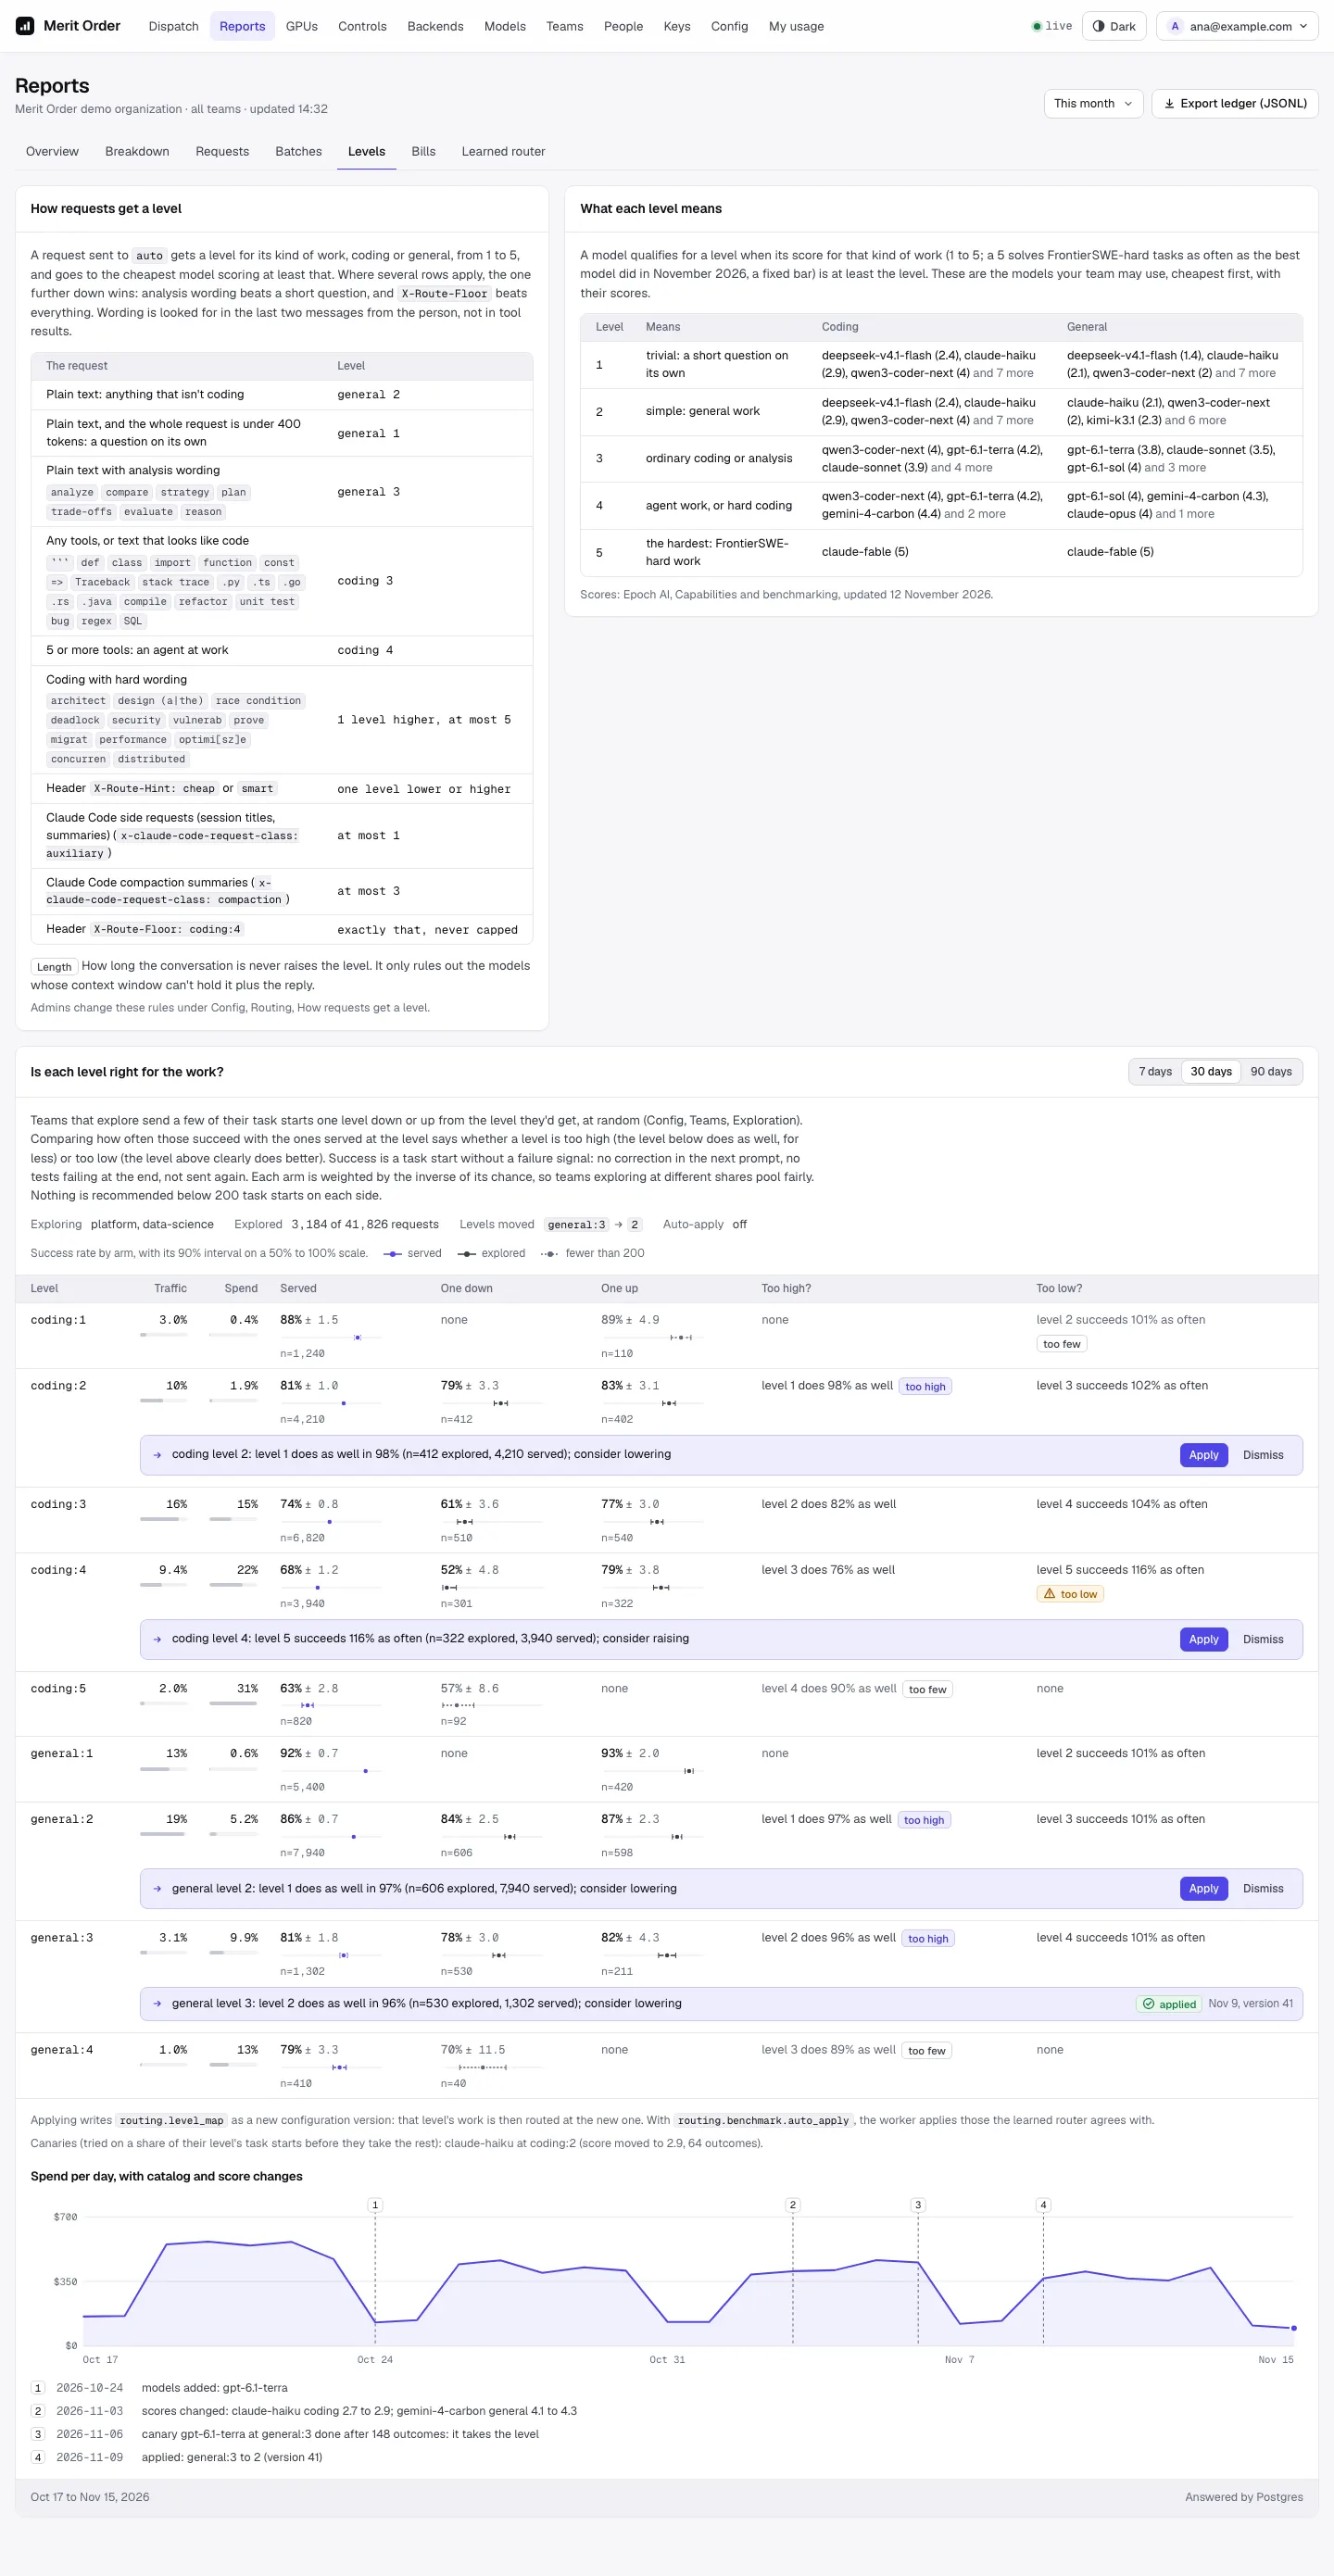
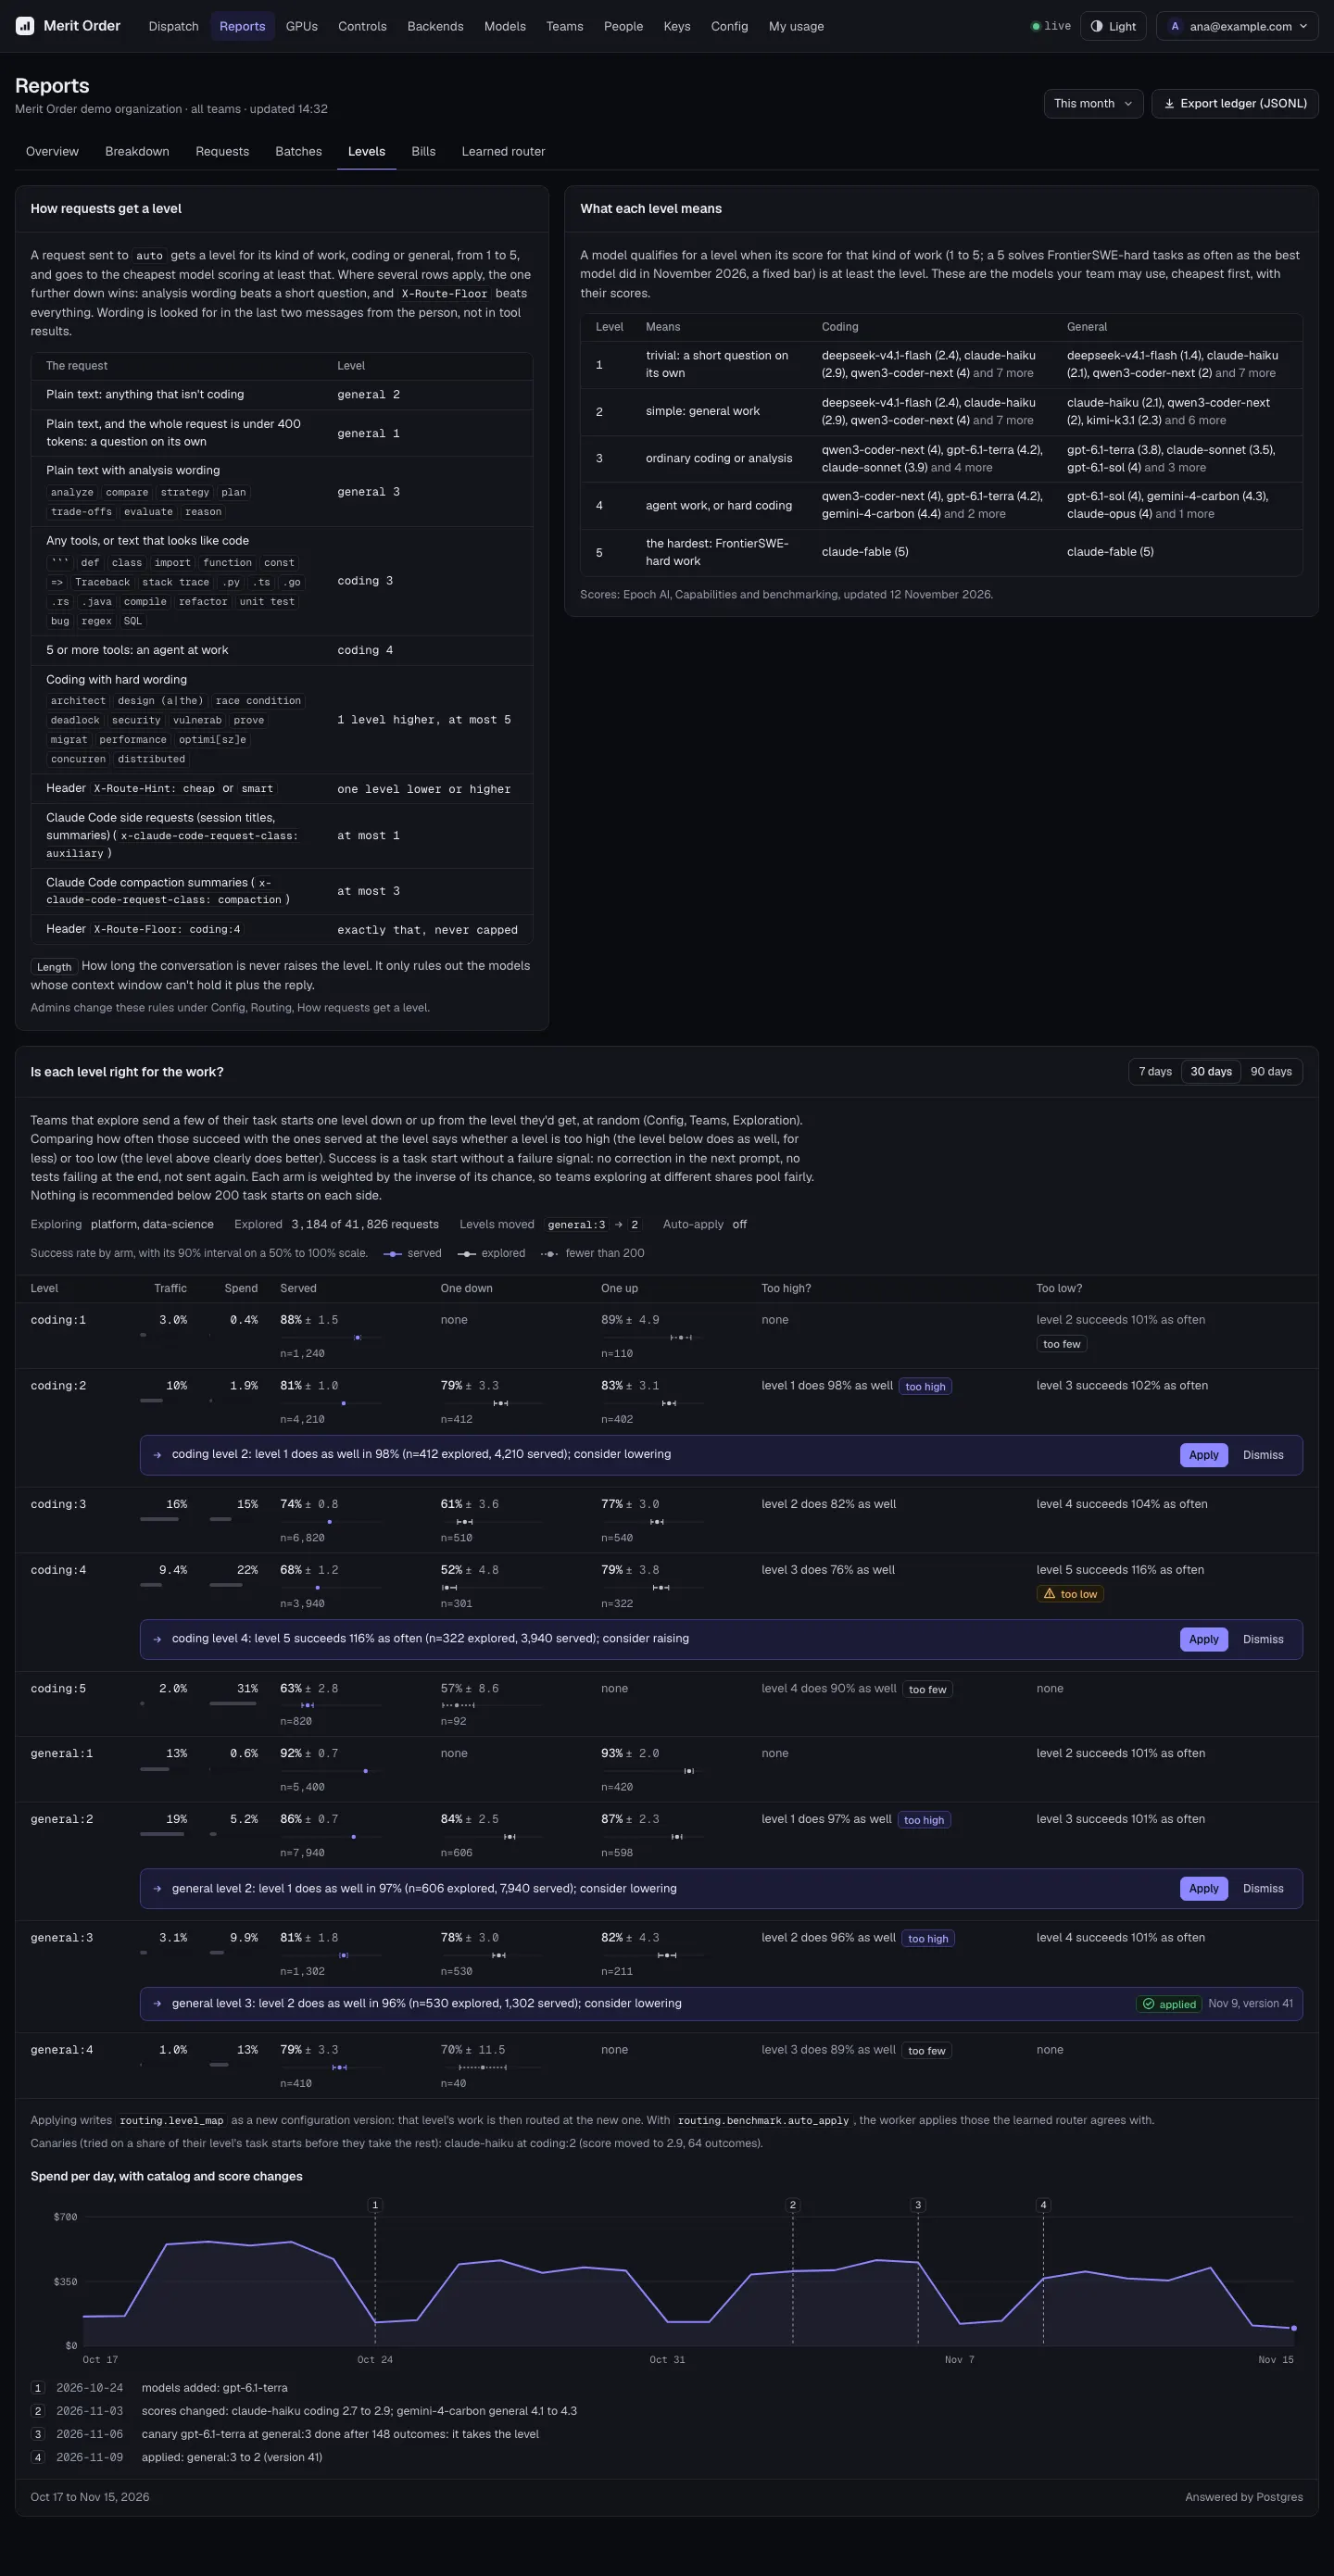
The Levels report: the rules that give each request a level, what each level means, and whether each level is right for the work, from exploration.The Levels report: the rules that give each request a level, what each level means, and whether each level is right for the work, from exploration.
Reports, Levels. Every level rule and its word list, in the open. With exploration on, each level shows how often the level below did as well, and a recommendation once each side has 200 task starts.
The GPUs page: deployments with their state, replicas and where they run, utilization, demand at API prices against the GPU price, and stop, drain and pin controls.The GPUs page: deployments with their state, replicas and where they run, utilization, demand at API prices against the GPU price, and stop, drain and pin controls.
GPUs. Each deployment's demand at API prices next to its hourly price, the state it is in (API only, starting, serving, draining), and the stop, drain and pin switches.
The Controls page: organization and GPU budgets with a month-end projection, safeguards such as the per-request ceiling, and team budgets.The Controls page: organization and GPU budgets with a month-end projection, safeguards such as the per-request ceiling, and team budgets.
Controls. Every cost next to the switch that controls it: the organization budget and its projection, the per-request ceiling, GPU caps, and each team's budget.